
Every dollar spent on advertising should generate measurable results. Return on ad spend, commonly called ROAS, is the metric marketers rely on to answer one simple question: for every dollar put into ads, how many dollars came back in revenue?
ROAS is not the same as profit, and it is not the same as ROI. It is a focused efficiency ratio that tells you exactly how well a specific ad campaign, channel, or budget is converting spend into revenue. Before you can optimize anything meaningfully, you need to understand what ROAS measures, how to calculate it correctly, and how to read the results in context.
What ROAS Measures in Marketing
ROAS measures ad-attributed revenue relative to advertising cost. If a campaign earns $8,000 in revenue and costs $2,000 to run, the ROAS is 4. That means every dollar spent returned four dollars in revenue.
The important distinction is that ROAS tracks revenue credited to ads specifically, not overall business revenue. Attribution models — last-click, first-click, or data-driven — determine which conversions get credited to which ads. The model you choose directly affects the ROAS number you see.
ROAS vs ROI: A Key Difference
ROI (return on investment) accounts for all business costs including production, fulfillment, and overhead. ROAS only divides revenue by ad spend. A campaign can show a high ROAS while still being unprofitable if product margins are thin or fulfillment costs are high. ROAS is a targeting efficiency signal, not a full profitability measure.
ROAS Formula Explained Simply
The ROAS formula has just two variables:
ROAS = Revenue from Ads ÷ Cost of Ads
You can express the result as a ratio (4:1) or as a multiple (4x). Both mean the same thing — four dollars earned for every one dollar spent on advertising.
Breaking Down Each Variable
- Revenue from Ads: The total revenue attributable to your ad campaign within the measurement window. This typically comes from your ad platform (Google Ads, Meta Ads) or an analytics tool with conversion tracking properly enabled.
- Cost of Ads: The total amount spent on that campaign. At minimum this is media spend — what you pay the platform. A more complete picture includes agency fees, creative production, and ad management software.
How to Calculate ROAS Step by Step
Follow these steps for any campaign:
- Define the campaign period — Set a fixed date range: weekly, monthly, or the full campaign window.
- Pull total ad revenue — Use conversion data from your ad platform or analytics tool. Verify that conversion tracking is correctly set up before pulling numbers.
- Record total ad spend — Include all costs attributed to the campaign in the same period.
- Apply the formula — Divide revenue by spend to get your ROAS ratio.
- Compare against your target — Measure against your target ROAS (tROAS), your break-even ROAS, and previous periods.
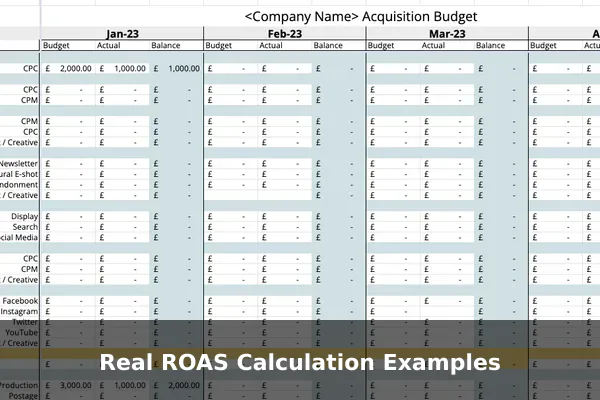
Real ROAS Calculation Examples
Example 1 — Google Search Campaign
A clothing retailer runs a Google Search campaign for one month:
- Ad spend: $3,000
- Revenue attributed to ads: $15,000
- ROAS = $15,000 ÷ $3,000 = 5x
Every dollar in search ads returned $5 in revenue. This is a strong result for a direct-response campaign targeting buyers with clear purchase intent.
Example 2 — Meta Social Ads Campaign
An online supplement brand runs a Meta campaign targeting fitness audiences:
- Ad spend: $5,000
- Revenue attributed to ads: $12,500
- ROAS = $12,500 ÷ $5,000 = 2.5x
The ROAS is lower than the search example, but if the brand’s gross margin is 60%, a 2.5x ROAS still covers costs and generates profit. Context matters more than the number alone.
Example 3 — Ecommerce Flash Sale
An ecommerce store runs a 48-hour sale with paid social and display ads:
- Ad spend: $1,200
- Revenue attributed to ads: $9,600
- ROAS = $9,600 ÷ $1,200 = 8x
Seasonal promotions often produce higher ROAS because of concentrated purchase intent. This result looks excellent, but it reflects a temporary spike and should not be treated as a repeatable baseline.
What Counts as Ad Spend
This is where many ROAS calculations become misleading. Some businesses count only media spend — the amount billed directly by the ad platform. A more accurate calculation includes:
- Agency management fees — If an agency manages your campaigns, their fee is part of your real ad cost.
- Creative production costs — Video production, graphic design, and copywriting created for ads.
- Tracking and attribution software — Third-party analytics or attribution platforms.
- Promotional discounts — Some businesses factor in revenue lost from discount codes promoted exclusively through ads.
Using only media spend inflates ROAS and can lead to poor budget decisions. The more complete your cost inputs, the more reliable your ROAS.
What Is a Good ROAS
There is no single universal benchmark. A good ROAS depends on three factors:
- Profit margins — A business running on a 20% gross margin needs a much higher ROAS to stay profitable than one with a 70% margin.
- Business model — Subscription businesses often accept a lower initial ROAS knowing customer lifetime value (LTV) will grow over time.
- Campaign objective — Brand awareness campaigns are not optimized for immediate revenue. Comparing their ROAS to a direct-response retargeting campaign is not useful.
Calculate your break-even ROAS before setting targets:
Break-even ROAS = 1 ÷ Gross Profit Margin
If your gross margin is 40%, your break-even ROAS is 2.5x. Any campaign below that number costs more than it earns. Most direct-response ecommerce campaigns target a minimum ROAS of 3x to 4x, but this varies significantly by industry and margin structure.
Common ROAS Mistakes That Skew Results
Ignoring Hidden Costs
Counting only media spend while leaving out agency fees, creative costs, or software makes ROAS appear higher than reality. This can cause you to keep spending on campaigns that are actually unprofitable.
Attribution Window Mismatch
Comparing campaigns that use different attribution windows (7-day vs 28-day click) produces incomparable numbers. Standardize attribution settings across all campaigns before drawing conclusions or making budget decisions.
Mixing Campaign Objectives
A top-of-funnel awareness campaign will almost always show a lower ROAS than a retargeting campaign. Cutting awareness campaigns based on ROAS alone can damage the pipeline that feeds your high-ROAS retargeting later.
Not Accounting for Returns
If your return rate is 15–20%, the revenue figures reported in your ad platform overstate actual revenue. Adjust for refunds before reporting ROAS to stakeholders or making optimization decisions.
How to Improve ROAS Without Guesswork
Improving ROAS means increasing ad-attributed revenue, reducing spend on low performers, or both. Practical tactics that deliver real results:
- Tighten audience targeting — Exclude audiences that click but do not convert. Narrowing demographics, interests, and lookalike audience thresholds finds higher-intent buyers.
- Improve landing page conversion rate — If your conversion rate doubles from 2% to 4%, revenue doubles on the same spend. This is the highest-leverage ROAS improvement available to most businesses.
- Pause low-performing ad sets — Audit campaigns weekly and cut anything running below break-even ROAS. Redirect that budget to campaigns that are working.
- Rotate creative regularly — Ad fatigue raises CPM and lowers click-through rate over time. Fresh creative stabilizes costs and maintains performance.
- Raise average order value — Upsells, bundles, and free shipping thresholds increase revenue per transaction without adding to ad spend, which directly lifts ROAS.
- Match message to intent — High-intent search ads should lead with direct offers. Retargeting ads should address objections and reinforce trust rather than reintroduce the product.
Conclusion
ROAS is one of the clearest efficiency signals available to any advertiser. It turns abstract campaign spending into a concrete, comparable number. But ROAS only gives useful information when revenue is tracked accurately, costs are fully included, and the result is read in context of margins and campaign objectives.
Start by calculating your break-even ROAS. Set a realistic target above that threshold, measure consistently across equivalent periods, and focus optimization efforts on the variables you can control: targeting quality, creative performance, landing page conversion, and offer relevance. ROAS is the scoreboard — understanding what drives those numbers is how you keep winning.