
Conversion rate is one of the most quoted numbers in marketing, but it is also one of the most misunderstood. On the surface, it looks simple: a single percentage that summarizes how often people do what you want them to do. In practice, the same campaign can produce very different conversion rates depending on what you count, how you count it, and which platform you are reading.
This guide walks through the conversion rate formula, real examples by channel, and how to use benchmarks responsibly. The goal is not to give you a magic target number, but to help you turn conversion rate into a decision-making metric rather than a vanity figure on a dashboard.
Before diving in, set the right expectation: the most useful comparison is almost always against your own historical performance and similar cohorts. Public benchmarks are context, not a verdict on whether your funnel is healthy.
What Conversion Rate Means in Marketing
In marketing, conversion rate measures the percentage of users, sessions, clicks, visitors, or recipients who complete a desired action within a defined window. The action is whatever you decide is valuable enough to track as a goal, which is why the same metric can describe very different behaviors.
Typical conversions include:
- An ecommerce purchase or completed checkout
- A lead form submission, demo request, or quote request
- A newsletter signup or account registration
- A mobile app install or first-open event
- A click on a key link inside an email campaign
- A phone call started from a paid ad or landing page
Because the action is configurable, conversion rate is best understood as a family of metrics rather than one universal number. Two teams reporting a 3% conversion rate may be measuring very different things, and comparisons only work when the underlying definitions match.
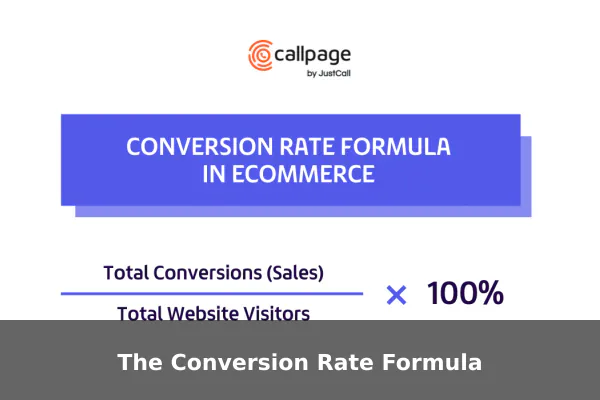
The Conversion Rate Formula
The core formula is straightforward:
Conversion Rate = (Conversions / Total Eligible Interactions) × 100
The numerator is the count of completed actions during the period. The denominator is the count of interactions that could have produced that action. The denominator is where most disagreements happen, because it changes by use case.
Common Denominators
- Ad clicks for paid search and paid social campaigns
- Sessions for website analytics and ecommerce reporting
- Users when measuring unique-visitor behavior
- Landing page visitors for a specific URL test
- Delivered emails for email click conversion rate
- Checkout starts for funnel-stage conversion rate
Always document which denominator you use. A team that reports a 4% rate against sessions and another that reports 4% against users are not actually comparing the same thing, because a single user can produce multiple sessions.
Conversion Rate Examples by Channel
The easiest way to understand the formula is to walk through small, realistic examples. Notice how the inputs change even when the campaign is identical.
Ecommerce Example
An online store receives 20,000 sessions in a month and records 400 completed orders. The session conversion rate is (400 / 20,000) × 100 = 2%. If 14,000 unique users produced those sessions, the user conversion rate would be roughly (400 / 14,000) × 100 ≈ 2.86%.
Lead Generation Example
A B2B landing page sees 5,000 visitors and produces 250 demo requests. The landing page conversion rate is (250 / 5,000) × 100 = 5%. If only 30 of those leads become paying customers, the lead-to-customer rate is (30 / 250) × 100 = 12%.
Paid Ads Example
A Google Ads campaign records 8,000 clicks and 320 conversions. The click conversion rate is (320 / 8,000) × 100 = 4%. This matches the definition Google Ads uses in its reporting interface, where conversion rate is calculated against clicks by default.
Email Marketing Example
An email goes to 50,000 recipients, 6,000 open it, and 900 click the main call-to-action. The click conversion rate against delivered emails is (900 / 50,000) × 100 = 1.8%. Calculated against opens, it would be (900 / 6,000) × 100 = 15%, which is why the denominator must be stated.
Conversions, Key Events, and Platform Terminology
Modern analytics tools do not all use the word "conversion" the same way, and this matters when you write reports or set targets.
Google Analytics 4 (GA4)
GA4 has moved toward the term key events for important user actions, while reserving "conversions" for cross-product, Google Ads–aligned reporting in many surfaces. According to Google’s official documentation, GA4 exposes metrics such as sessionKeyEventRate and userKeyEventRate in its Data API, which roughly correspond to session-level and user-level conversion rates against any key event you have configured.
Google Ads
Google Ads continues to define conversion rate as conversions divided by interactions (typically clicks), expressed as a percentage. That definition has stayed stable in the platform’s help documentation and is what most paid media reports refer to when they cite "CVR."
Why It Matters
When you say "our conversion rate is 3%," specify the platform and the event. A GA4 key event rate, a Google Ads conversion rate, and a Shopify checkout rate may all be valid, but they answer different questions. Treat them as related cousins, not interchangeable twins.
Common Types of Conversion Rates
Most mature marketing teams track several conversion rates side by side, because each one tells a different story about the funnel.
- Session conversion rate: Conversions divided by sessions. Useful for traffic-quality analysis.
- User conversion rate: Conversions divided by unique users. Less inflated by repeat visits.
- Click-to-conversion rate: Conversions divided by ad clicks. Standard for paid media.
- Visitor-to-lead rate: Leads divided by landing page visitors. Common in B2B.
- Lead-to-customer rate: Customers divided by leads. A sales efficiency signal.
- Checkout conversion rate: Orders divided by checkout starts. Highlights friction in payment flows.
- Email click conversion rate: Clicks divided by delivered or opened emails, depending on convention.
Tracking the full chain often reveals more than any single rate. A landing page may convert well at the form, but the leads may convert poorly downstream, suggesting a targeting issue rather than a page issue.
What Counts as a Good Conversion Rate?
There is no universal "good" conversion rate, and any source that claims one almost always hides important caveats. The honest answer is that several variables move the number significantly, often more than the quality of your marketing.
Variables That Move the Number
- Industry: A subscription software product and a luxury furniture brand operate in very different conversion realities.
- Traffic source: Branded search typically converts higher than cold display traffic because intent is stronger.
- Device: Mobile sessions often convert at lower rates than desktop, especially for high-consideration purchases.
- Offer and price point: Free trials convert differently than $5,000 packages.
- Brand trust: Established brands tend to convert higher even without changing copy.
- Funnel stage: Top-of-funnel awareness traffic converts lower than retargeting traffic.
Before judging a number as good or bad, ask whether the comparison group matches your industry, traffic mix, price, and funnel stage. If it does not, the benchmark is informative at best and misleading at worst.
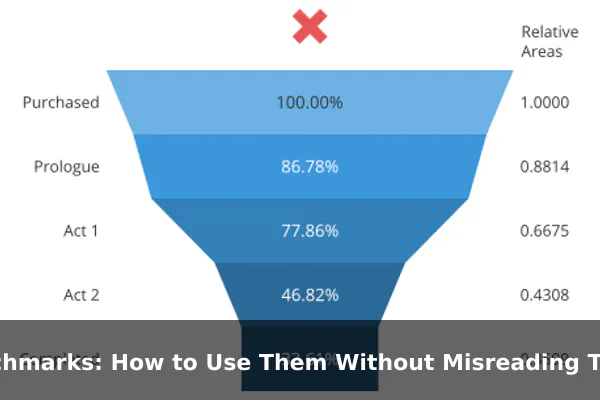
Benchmarks: How to Use Them Without Misreading Them
Benchmarks are useful when treated as orientation, not a target. Two well-known examples illustrate how to read them carefully.
Ecommerce Benchmarks
Shopify publishes a benchmarks methodology in its Help Center that segments stores by industry and uses cohort logic with percentile ranges. The documentation also notes important platform timelines and methodology updates, so any specific figure should be checked against the current Shopify documentation rather than older blog posts repeating outdated numbers.
Email Benchmarks
Mailchimp maintains an email marketing benchmarks page broken down by industry, with open, click, and unsubscribe rates. Even within Mailchimp’s own data, rates vary widely by industry, so a 2% click rate may be strong in one vertical and weak in another. Always cite the industry row, not the headline average.
How to Read Benchmarks Safely
- Find the cohort that genuinely matches your business.
- Check the publication date and methodology notes before quoting numbers.
- Compare percentile ranges, not just averages, since averages hide tails.
- Use benchmarks to spot outliers in your own data, not to set rigid quotas.
- Recheck primary sources directly rather than relying on third-party summaries.
How to Improve Conversion Rate
Once you trust the measurement, the optimization levers become more practical. Most improvements come from a small number of high-impact areas rather than constant cosmetic tweaks.
- Clarify the offer: Make the value, price, and next step unmistakable above the fold.
- Strengthen the CTA: Use specific, action-oriented language that matches user intent.
- Reduce friction: Shorten forms, simplify checkout, and remove unnecessary steps.
- Improve page speed: Slow pages quietly suppress conversion across every channel.
- Tighten targeting: Better-matched traffic converts better than more traffic.
- Add trust signals: Reviews, guarantees, security badges, and clear policies help hesitant buyers.
- Segment email: Tailored content typically lifts click and conversion rates compared with broadcasts.
- Run A/B tests: Validate changes with statistical significance, not gut feel.
Mistakes That Distort Conversion Rate Reporting
Even careful teams make reporting mistakes that quietly damage decision-making. Watch out for these patterns.
- Mixing denominators: Comparing a session-based rate to a user-based rate as if they are the same metric.
- Double-counting conversions: Counting both a lead and a sale as separate conversions in the same funnel without labeling stages.
- Comparing unlike channels: Holding paid search and display to the same target despite very different intent levels.
- Ignoring sample size: Declaring a winner from 50 conversions when normal variance can easily flip the result.
- Using outdated benchmarks: Quoting figures from older posts that no longer reflect current platform methodology.
- Optimizing low-value conversions: Driving up signups that never become customers, which lifts the rate but lowers revenue.
How to Track Conversion Rate Consistently
Consistency is what makes conversion rate trustworthy over time. Without a stable definition, trends become impossible to interpret because you cannot tell whether the metric moved or the measurement moved.
A Repeatable Tracking Routine
- Define the conversion action in writing, including any qualifying conditions.
- Choose the denominator deliberately and document why it fits the question you are answering.
- Document platform rules: note how GA4, Google Ads, your CRM, and your ecommerce platform each report the metric.
- Segment reports by channel, device, geography, and new versus returning users so averages do not hide divergent stories.
- Monitor trends over rolling windows rather than single weeks, which can be noisy.
- Review after changes: whenever you update tracking, redirects, or campaign structure, re-validate that historical comparisons are still valid.
Conclusion
Conversion rate is a powerful metric precisely because it compresses a lot of behavior into a single percentage. That compression is also its weakness: it hides the definitions, denominators, and cohorts that make the number meaningful. The most effective marketers treat conversion rate as a conversation starter, not a verdict.
Use the formula consistently, name the denominator every time, and prefer comparisons against your own past data and tightly matched cohorts. Use benchmarks from primary sources like Google, Shopify, and Mailchimp as orientation rather than as targets. With that discipline, conversion rate becomes what it should be: a clear, repeatable signal you can act on with confidence.
Official references
- Google Analytics Data API Dimensions & Metrics – Defines GA4 key event rate metrics such as sessionKeyEventRate and userKeyEventRate, useful for accurate analytics terminology.
- Google Analytics Help: Conversions vs. Key Events – Explains current GA4 terminology separating key events from conversions, important for avoiding outdated conversion definitions.
- Google Ads Help: Conversion Rate Definition – Official Google Ads definition of conversion rate for paid advertising reporting.
- Shopify Help Center: Benchmarks in Reports – Primary Shopify reference for ecommerce benchmark methodology, cohort logic, percentiles, and the May 19, 2026 deprecation note.
- Mailchimp Email Marketing Benchmarks – Primary email marketing benchmark data by industry for open, click, and unsubscribe rates.