
Every business wants more customers. But the smarter question is: how much is each customer actually worth over their entire relationship with your brand? That question is exactly what Customer Lifetime Value (CLV) answers. Instead of focusing only on single transactions, CLV forces marketers to think long-term — how much revenue will one customer generate from the first purchase to the last?
CLV sits at the intersection of acquisition, retention, and profitability. When you know how much a typical customer is worth, you can set smarter advertising budgets, decide how much to spend bringing in new customers, and identify which segments deserve the most loyalty investment. Without CLV, many businesses overspend on acquisition while underinvesting in retention — a costly imbalance that quietly erodes margins.
This guide walks you through the core CLV formulas in plain language, shows step-by-step calculations, and illustrates how real businesses across ecommerce, subscriptions, and services apply CLV to make better marketing decisions every day.
What Customer Lifetime Value Means in Marketing
Customer Lifetime Value is the total net revenue a business can expect from a single customer account over the entire duration of their relationship. It is sometimes called LTV (Lifetime Value) or CLTV. Regardless of the label, the concept is the same: project the financial worth of a customer beyond the first sale.
Marketers use CLV to answer questions like:
- How much can we afford to spend acquiring a new customer?
- Which customer segments are most valuable?
- Where should retention efforts be focused?
- Are our loyalty programs generating real returns?
CLV shifts the marketing mindset from transaction-focused to relationship-focused. A coffee shop customer who visits three times a week for five years is worth dramatically more than one who buys once and never returns. If the marketing team treats both equally, they will waste budget on low-value customers and underserve high-value ones.
Why CLV Matters More Than Revenue Per Transaction
Average order value and revenue per transaction are useful metrics, but they capture only a snapshot. CLV takes the full picture into account. A customer who makes five small purchases per year for ten years may generate far more total revenue than a customer who makes one large purchase and disappears.
Knowing CLV also helps businesses prioritize customer experience investment. If you discover that customers who receive personalized follow-up emails have a 40% higher CLV than those who do not, the business case for email automation becomes impossible to ignore.
The Basic CLV Formula Explained
The simplest version of the CLV formula combines three inputs that most businesses can calculate directly from their sales data:
CLV = Average Purchase Value × Purchase Frequency × Customer Lifespan
Each variable is defined as follows:
- Average Purchase Value (APV): Total revenue divided by the number of orders in a given period.
- Purchase Frequency (PF): Total number of orders divided by the number of unique customers in that same period.
- Customer Lifespan (CL): The average number of years a customer continues buying from you.
This formula produces a revenue-based CLV. For a profit-based CLV — which is what should drive marketing budget decisions — multiply the result by your average gross margin:
CLV (profit) = Average Purchase Value × Purchase Frequency × Customer Lifespan × Gross Margin %
When the Basic Formula Is Enough
For small businesses, startups, and early-stage campaigns, the basic formula is perfectly adequate. It gives a directional number that helps inform budget decisions without requiring advanced data science. If your business has relatively stable purchase patterns and low variability in customer behavior, the simple model delivers reliable estimates that are good enough to act on.
How to Calculate CLV Step by Step
Here is a complete calculation using a fictional online bookstore called PageTurn. Their annual data shows:
- Total revenue: $500,000
- Total orders: 5,000
- Unique customers: 1,000
- Average customer lifespan: 3 years
- Gross margin: 35%
Step 1 — Calculate Average Purchase Value
APV = $500,000 ÷ 5,000 = $100
Step 2 — Calculate Purchase Frequency
PF = 5,000 ÷ 1,000 = 5 purchases per year
Step 3 — Calculate Annual Customer Value
Annual Value = $100 × 5 = $500 per year
Step 4 — Calculate Revenue CLV
CLV = $500 × 3 = $1,500
Step 5 — Calculate Profit CLV
CLV (profit) = $1,500 × 0.35 = $525
Each customer at PageTurn is worth approximately $525 in profit over their lifetime. That number becomes a ceiling for acquisition spending and a baseline for all retention investment decisions.
Adjusting for Churn Rate
Many businesses find it easier to estimate customer lifespan using their churn rate rather than tracking individuals over time. The formula is straightforward:
Customer Lifespan = 1 ÷ Annual Churn Rate
If PageTurn loses 33% of customers each year, the average lifespan is 1 ÷ 0.33 = approximately 3 years — consistent with the number used above. When churn rises, lifespan falls, and CLV contracts accordingly.
Real CLV Examples From Different Business Types
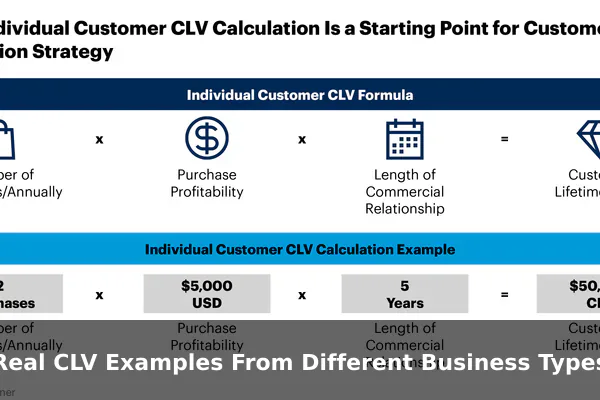
CLV calculations look different depending on the business model. Below are three concrete examples that show how the numbers shift across different revenue structures.
Ecommerce CLV Example
A fashion ecommerce brand sells casual clothing with the following figures:
- Average order value: $75
- Purchase frequency: 4 times per year
- Average customer lifespan: 2.5 years
- Gross margin: 45%
CLV (revenue) = $75 × 4 × 2.5 = $750
CLV (profit) = $750 × 0.45 = $337.50
This tells the marketing team that spending more than $337.50 to acquire a customer will result in a loss. With paid ads, they know to keep their cost per acquisition (CPA) below that threshold.
Subscription Business CLV Example
A software-as-a-service (SaaS) company charges $49 per month. Their average subscriber stays for 18 months.
CLV (revenue) = $49 × 12 × 1.5 = $882
CLV (profit) = $882 × 0.70 = $617.40
Subscription businesses often carry strong CLV because margins are high and repeat billing is automatic. This number guides how aggressively the company can invest in free trials, onboarding, and churn-prevention campaigns.
Local Service Business CLV Example
A local accounting firm charges clients an average of $1,200 per year. Clients typically stay for 6 years.
CLV (revenue) = $1,200 × 6 = $7,200
CLV (profit) = $7,200 × 0.30 = $2,160
A profit CLV of $2,160 easily justifies referral bonuses, loyalty discounts, and personalized outreach — all tactics that would be difficult to justify based on a single-year view.
CLV vs CAC: Why the Relationship Matters
Customer Acquisition Cost (CAC) is the total amount spent to acquire one new customer. The ratio between CLV and CAC is one of the most important signals in marketing:
LTV:CAC Ratio = CLV ÷ CAC
Industry benchmarks generally interpret the ratio as follows:
- Below 1:1 — You are losing money on every customer acquired.
- 1:1 to 2:1 — Marginally sustainable, with very little room for growth investment.
- 3:1 — Healthy. Generally the target for most growing businesses.
- Above 5:1 — Strong unit economics, but may indicate underinvestment in acquisition and missed growth opportunity.
Applying the Ratio in Practice
Using the PageTurn example: if profit CLV is $525 and the team spends $150 to acquire each customer, the ratio is $525 ÷ $150 = 3.5:1 — a healthy position. If CAC rises to $400 due to increased ad competition, the ratio drops to 1.3:1, which signals an unsustainable trajectory that demands either improved retention or reduced acquisition spend.
Common CLV Mistakes That Skew Results
Understanding where CLV calculations go wrong helps you build more reliable models and avoid decisions based on misleading numbers.
Using Overall Averages Instead of Segments
One of the most frequent errors is blending high-value and low-value customers into a single average. A retail brand might have loyal buyers who purchase twelve times a year alongside one-time deal hunters who never return. Averaging these together produces a CLV number that accurately describes nobody. The fix is to segment customers by behavior, acquisition channel, or product category and calculate CLV separately for each group.
Ignoring Churn
Businesses often calculate CLV assuming all current customers will continue indefinitely. In reality, a portion stops buying every period. Ignoring churn inflates CLV projections significantly. Always incorporate churn rate into your customer lifespan estimate using historical data.
Confusing Revenue CLV With Profit CLV
Revenue-based CLV looks impressive but can be deeply misleading. A customer generating $5,000 in revenue at a 5% margin contributes only $250 in profit. Marketing budget decisions must always be grounded in profit CLV, not gross revenue figures.
Forgetting the Cost to Serve
Some customers generate high revenue but also high service costs — frequent returns, extended support tickets, or custom demands that absorb team time. These costs reduce true CLV. A net CLV model accounts for both the revenue generated and the actual cost required to serve that customer over their lifetime.
How to Increase Customer Lifetime Value
Calculating CLV is only useful if it drives action. These are the highest-leverage tactics for raising CLV across different business types.
Retention Campaigns
Retention is the single biggest lever for CLV. Extending average customer lifespan from two years to three years increases CLV by 50% without touching purchase value or frequency. Effective tactics include:
- Win-back email sequences for lapsed customers
- Loyalty programs that reward cumulative spending
- Proactive check-ins for subscription and service customers
- Anniversary or milestone offers timed to relationship length
Upsells and Cross-Sells
Increasing average purchase value or purchase frequency directly raises CLV. Post-purchase upsells — premium add-ons, extended warranties, complementary products — are particularly effective because the customer has already demonstrated buying intent. Cross-selling related items based on purchase history raises frequency without requiring new acquisition spend.
Stronger Onboarding
The period immediately after a first purchase is when churn risk is highest. Customers who do not quickly experience value often do not return. A deliberate onboarding sequence — a welcome email series, product tutorial, or short onboarding call — dramatically reduces early churn and builds the habits that sustain long-term purchasing.
When to Use Simple CLV and When to Use Advanced Models
The basic CLV formula works well for many situations, but there are contexts where a more sophisticated approach delivers meaningfully better results.
Use Simple CLV When
- Your business is small or early-stage with limited purchase history
- Customer behavior is relatively consistent across your base
- You need a quick directional estimate to guide a single budget decision
- You lack the data infrastructure or resources to maintain a complex model
Use Predictive CLV When
- Your customer base is large with highly varied behavior across segments
- You have at least two years of clean transaction data across thousands of customers
- You want to score individual customers for personalized marketing campaigns
- You operate in a high-churn environment where segment-level averages miss important variation
Predictive CLV models use machine learning to estimate the probability that each customer will make future purchases and how much they will spend. Platforms including Klaviyo, Salesforce, and Shopify now include built-in CLV scoring tools, making advanced modeling accessible to mid-sized businesses without a dedicated data science team.
A Simple Decision Checklist
- Do I have at least two years of clean transaction data? If yes, consider predictive modeling.
- Is customer behavior highly variable across my base? If yes, segment at minimum before calculating.
- Am I making a major acquisition budget decision? If yes, use profit CLV, never revenue.
- Do I have the tools and bandwidth to maintain a complex model? If no, start simple and iterate.
Conclusion
Customer Lifetime Value is one of the most actionable metrics in marketing. It transforms how businesses think about customers — shifting focus from one-time transactions to long-term relationships and from revenue figures to actual profitability. Whether you run a small ecommerce store or a growing SaaS business, the CLV formula gives you a concrete foundation for smarter acquisition budgets, better retention strategies, and more targeted loyalty investment.
Start with the simple formula, calculate your current CLV by segment, and compare it against your acquisition costs. That single exercise will surface more strategic clarity than almost any other marketing analysis you can run. As your data matures and your business scales, upgrade to predictive models — but never lose sight of the fundamental principle: the goal is not just to get customers, it is to keep them long enough to make the relationship genuinely profitable.